Google Sheets is a powerful tool for data analysis, but adding custom drawings can make your spreadsheets even more insightful. Whether you're creating flowcharts, diagrams, or simple annotations, Google Drawings integrates seamlessly to provide visual context for your data.
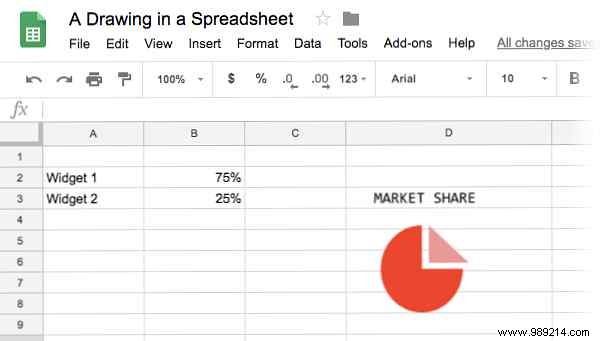
Custom sketches or drawings can elevate your spreadsheets by supporting key data points, like flowcharts for investment projections or maps for demographics. Here's how to do it:
Drawings are separate documents, so sharing permissions apply independently. Collaborators can view the drawing but need edit access to modify it via double-click.
This feature shines for quick additions like straight lines to highlight data—just draw on the canvas and position it precisely.