As a data analyst with over a decade of experience using Google Sheets for budgeting, reporting, and complex analysis, I've relied on pivot tables to summarize and explore large datasets effortlessly. Pivot tables let you generate insightful summaries from your spreadsheet data, making it simple to analyze or compare volumes of information with just a few clicks.
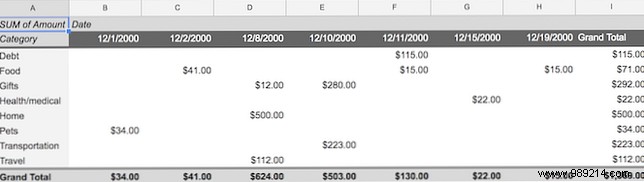
For instance, in a personal or business budget spreadsheet, a pivot table can instantly reveal spending by category, helping you spot trends and make informed decisions.
While pivot tables unlock advanced capabilities like custom calculations and filtering, mastering the basics opens the door to powerful data manipulation. Here's how to create one in Google Sheets, using a monthly budget example from the Google Sheets Monthly Budget Template.
Ensure each data column has a clear header row before starting—this is essential for accurate results.
Select the range of cells containing your data (or the entire sheet if preferred).
From the menu, go to Data > Pivot table.
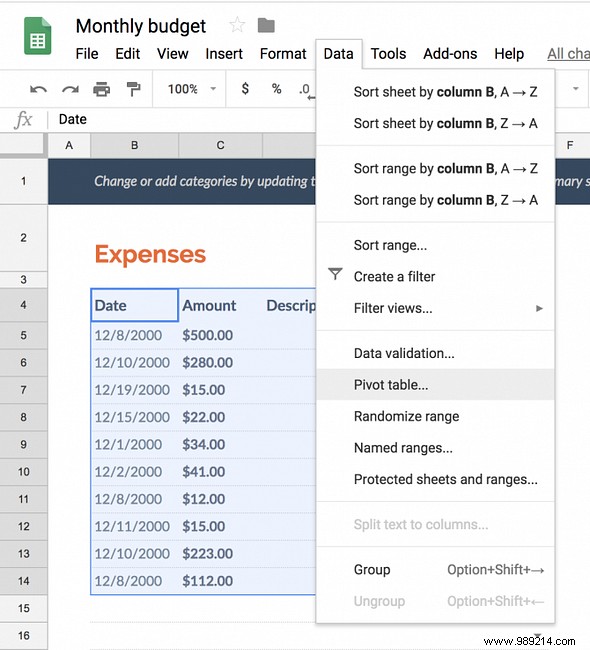
This opens a new sheet with the Pivot table editor sidebar. Here, customize your summary by defining rows, columns, and values.
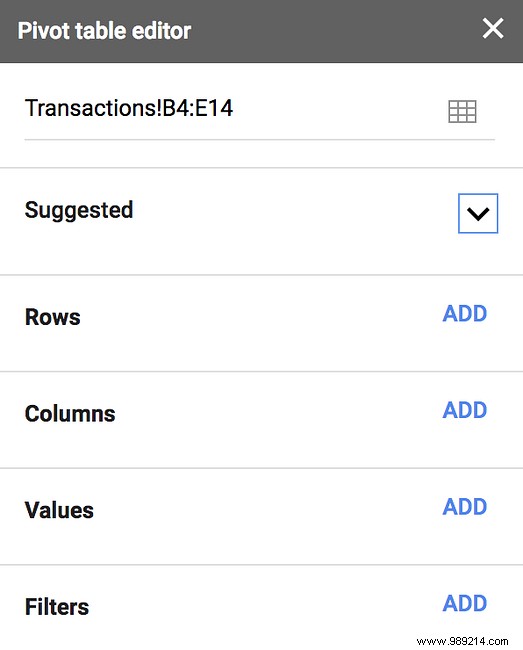
(Google Sheets also suggests "Explore" recommendations for quick pivot tables.)
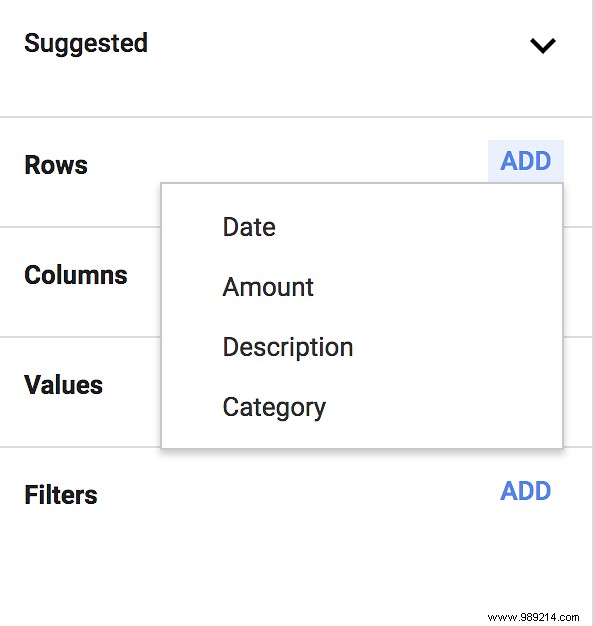
Under Rows, click Add and choose your grouping field—like "Expenses category" for a budget sheet.
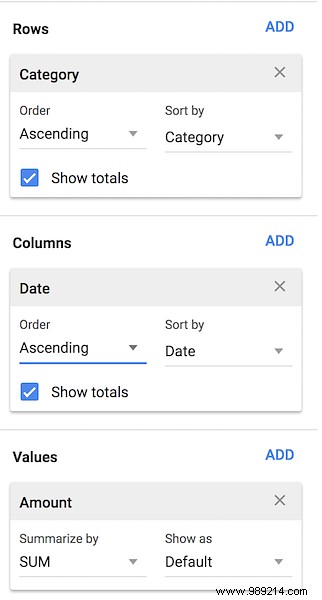
For Columns, add fields to break down rows further, such as transaction dates alongside expense types.
Under Values, select the metric to summarize (e.g., "Amount" for totals) and choose SUM, COUNT, or other functions.
Your pivot table now displays dynamically on the new sheet. It updates automatically as you add or edit data in the source range.
For deeper insights on pivot tables in Microsoft Excel, check out our guide: How to Use an Excel PivotTable for Data Analysis. This powerful tool excels in big data scenarios—follow the step-by-step demo to get started.