Excel offers powerful built-in tools for analyzing and visualizing business data, whether you're preparing exports for BI systems, pivoting to uncover trends, or creating compelling visuals. These tools outperform basic spreadsheets, providing desktop and cloud options that integrate seamlessly. With deep expertise in Excel's ecosystem, we've guided countless professionals to transform raw data into actionable insights.
In this guide, we explore Power Pivot, Power Query, Power View, Power Map, and cloud-based Power BI. These interconnected features make Excel a data mastery powerhouse, enabling you to handle massive datasets and reveal hidden patterns effortlessly.
Excel's strength lies in how these tools work together: mastering one unlocks the potential of others, positioning you as the go-to data expert in your organization.
Power Pivot, a cornerstone Excel add-in, revolutionized data modeling since its 2010 debut. Renowned Excel authority Bill Jelen called it 'the best new feature in twenty years.' Integrated into Excel 2013 and later (including Office 2016 via Office 365), it's ideal for big data analysis.
This tool imports millions of rows from external sources, extends pivot tables, and supports advanced modeling. Key uses include:
Power Pivot forms the foundation for Power BI, turning raw data into insightful models.
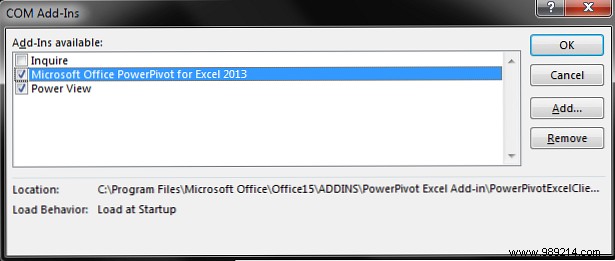
Power Pivot is built-in but requires activation.
Office 2013/2016: Go to File > Options > Add-ins. Select COM Add-ins from the Manage dropdown, click Go, check Microsoft Office Power Pivot for Office 20xx, and click OK.
Office 2010: Download and install Power Pivot for Excel 2010 (link no longer available). The tab appears post-installation.
Power Query excels at extracting, transforming, and loading data from diverse sources. Essential for professionals, it offers precise control over data shaping and cleansing.
Capabilities include:
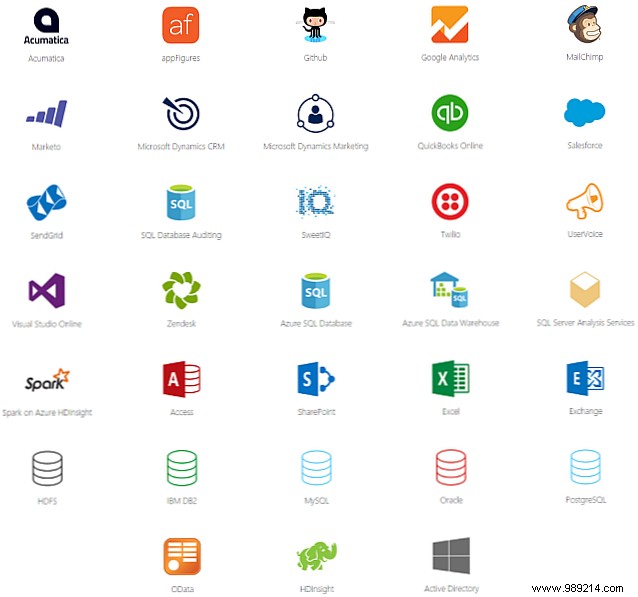
Supported sources: Web pages, Excel/CSV/XML/Text files, Folders, SQL Server, Azure, Access, Oracle, DB2, MySQL, PostgreSQL, Sybase, Teradata, SharePoint, OData, Azure Marketplace, Hadoop, HDInsight, Table Storage, Active Directory, Exchange, Facebook.
It feeds Power Map and View, restoring data for deeper analysis.
Office 2016: File > Options > Add-ins > COM Add-ins > Check Microsoft Office Power Query for Office 2016.
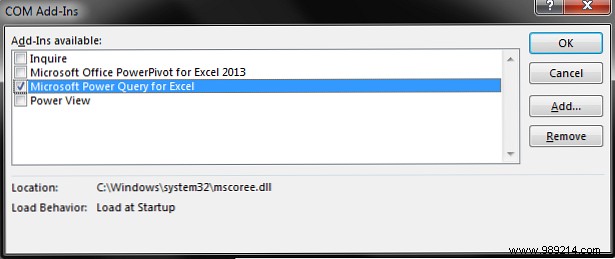
Office 2010/2013: Download and install from Microsoft. Activate via Add-ins if needed.
Power View provides interactive, drag-and-drop visualizations, often paired with Power Pivot. It groups data intelligently, connects multiple models, supports on-the-fly edits, KPIs, and advanced charts like enhanced pie charts.
Available in Excel 2013/2016 (SharePoint 2010 compatible with limitations).
Office 2013/2016: File > Options > Add-ins > COM Add-ins > Check Power View.
Power Map plots data in 3D, perfect for geographic or time-based visuals. Features:
Office 365 ProPlus/Office 2016: Activate via File > Options > Add-ins > COM Add-ins > Microsoft Power Map for Excel.
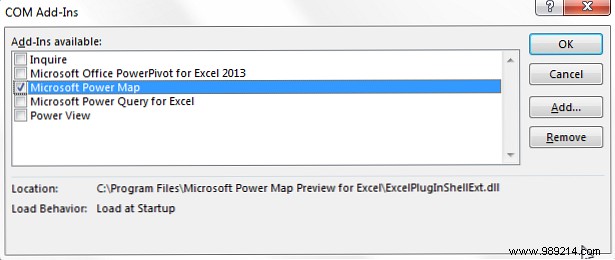
Office 2013: Download preview. Use via Insert > Map. Not for 2010.
Power BI unifies these tools into a cloud-based BI platform, with Excel-integrated and Desktop versions sharing engines, DAX, and SharePoint access.
Office 2016 updates: 30+ DAX functions, Query Editor, auto-suggested relationships, forecasting, field summaries, HDInsight/Spark connectors.
Power BI's motto: "Bring your data to life," via drag-and-drop canvases for interactive dashboards and reports.
Download Desktop from Microsoft. Pro ($10/user/month): 10GB data, hourly refreshes, team sharing. Office 2016/2013 ProPlus required for full integration; XLSX compatible with 2010.
These tools empower data mastery, integrating into Power BI for competitive edges via dashboards and visuals. Experiment to find your favorites.
What's your go-to Excel power tool? Desktop or integrated Power BI? Share below.