As a data analyst with years of experience relying on Excel for quick insights, I know specialized statistical software excels at complex tasks like t-tests and chi-square analyses. However, Excel's Data Analysis ToolPak makes basic stats accessible and reliable without switching tools.
Excel's built-in functions can feel clunky and yield obscure outputs. That's why I always recommend enabling the ToolPak—it's a game-changer for descriptive stats, hypothesis testing, and more.
While possible without it, stats are far simpler with the ToolPak. In Excel 2016 (steps similar in later versions), go to File > Options > Add-ins.
Click Go next to "Manage: Excel Add-ins."
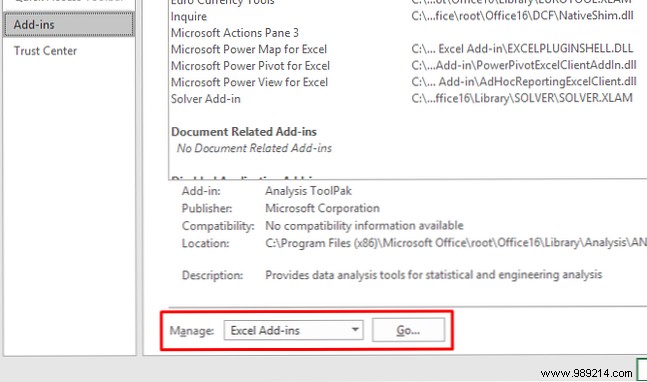
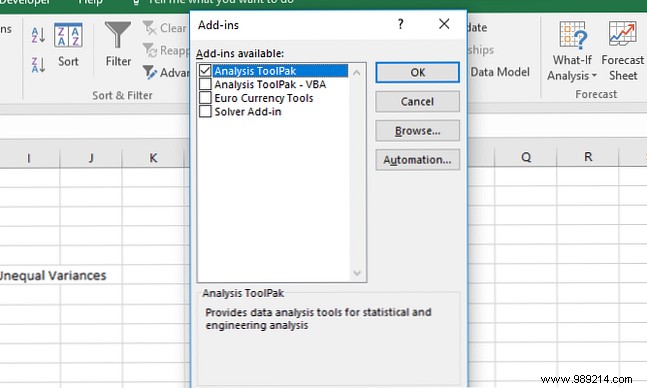
In the dialog, check Analysis ToolPak and click OK.
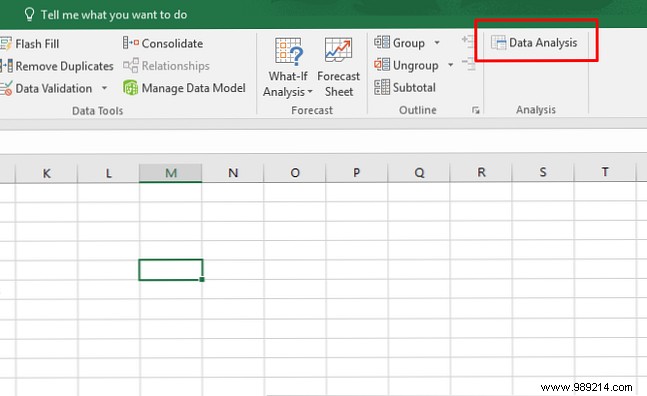
Success? You'll see Data Analysis under the Data tab's Analysis group:
For extra capabilities, explore these add-ins: Power Up Excel With 10 Add-ins To Process, Analyze, And Visualize Data Like A Pro. Vanilla Excel is powerful, but plugins supercharge it for any data task.
Start any analysis with descriptives: means, medians, variance, standard deviation, skewness, kurtosis, and more.
Click Data Analysis on the Data tab, select Descriptive Statistics, and choose your input range. Click the arrow, drag to select data, and hit Enter.
Specify labels, output sheet, and summary statistics options.
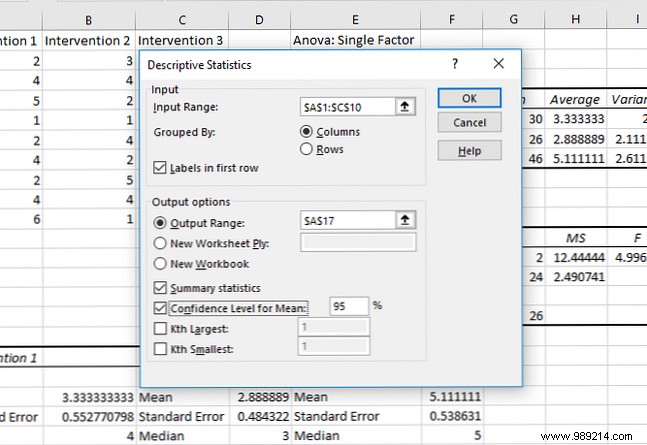
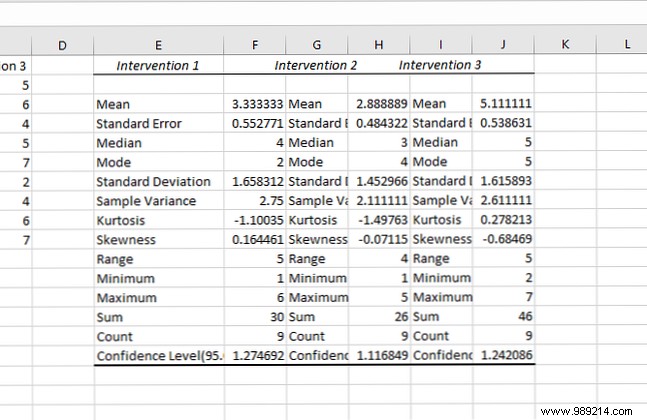
Click OK for results:
The t-test is foundational; the ToolPak simplifies it. Click Data Analysis and scroll to t-test options.
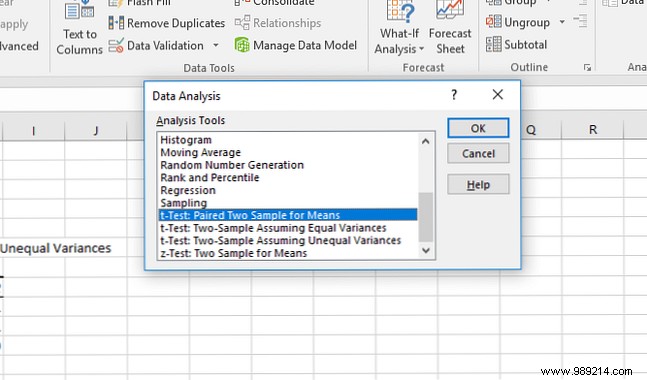
Choose from:
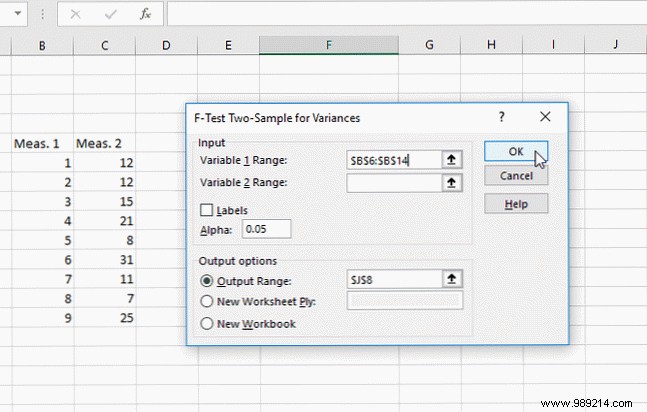
Test variances first with F-Test Two-Sample for Variances.
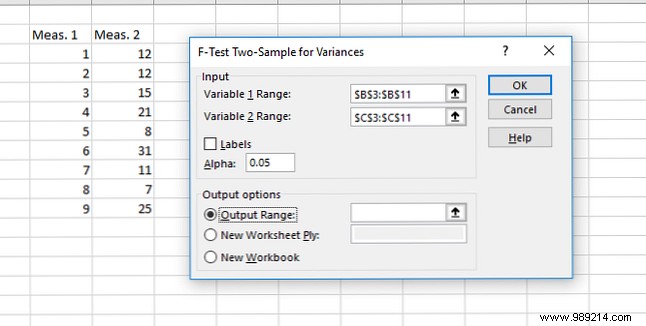
Enter ranges, set alpha to 0.05, and click OK.
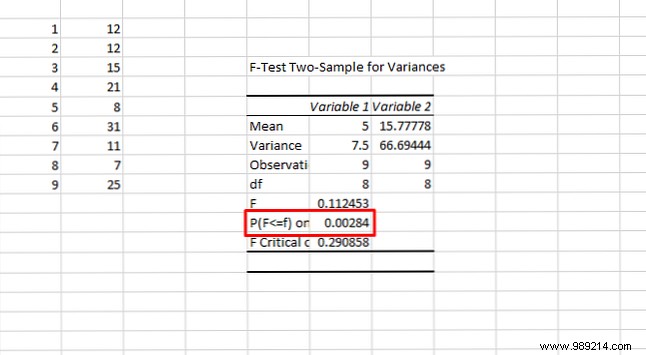
If p < 0.05, use unequal variances option. Select appropriate t-test, input ranges, alpha 0.05, and OK.
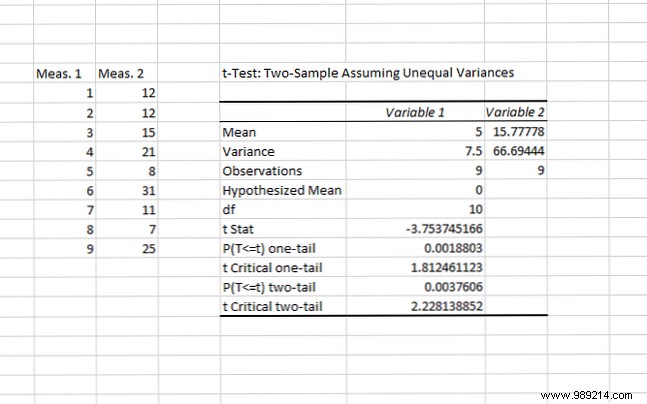
Results include means, df, t-stat, and one/two-tail p-values. p < 0.05 means significant difference. Unsure about one vs. two-tail? See UCLA's explainer.
ToolPak offers three ANOVA types but no post-hoc tests like Tukey. Great for detecting group differences.
For single-factor: Click Data Analysis > ANOVA: Single Factor.
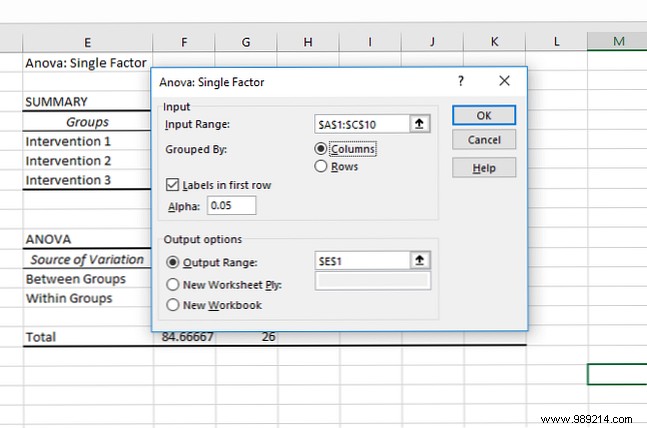
Select range, grouped by columns/rows, labels if present. Click OK.
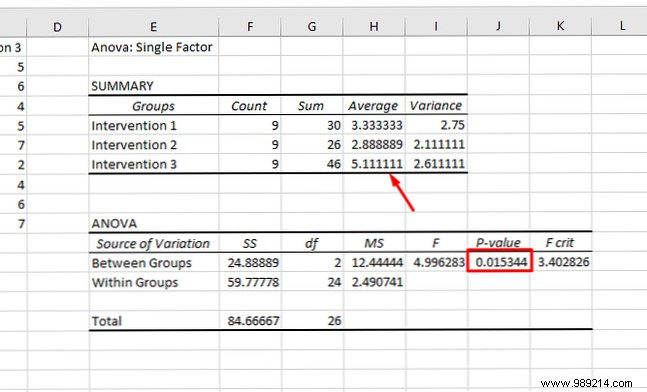
p < 0.05? Significant difference exists. Check means to infer which groups differ (note: not statistically rigorous without post-hocs). For two-factor details, watch Sophia.org's video.
Simpler: Select Correlation.
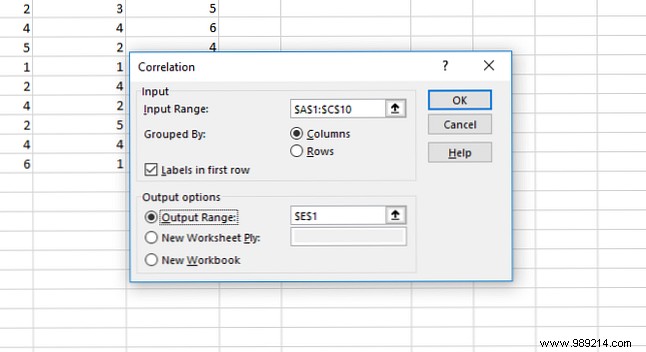
Input range, groups by columns/rows, labels. OK.
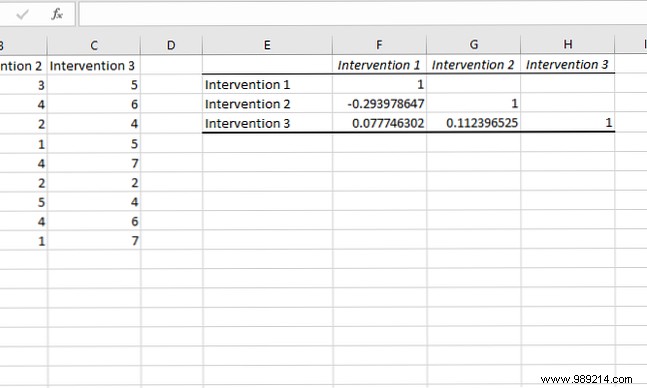
Values near 1/-1 indicate strong correlation; no significance test.
Excel shines here for multiple regression. Example: blood pressure (Y) vs. weight/salt intake (X).
Select Regression, Y-range (dependent), X-range (independents).
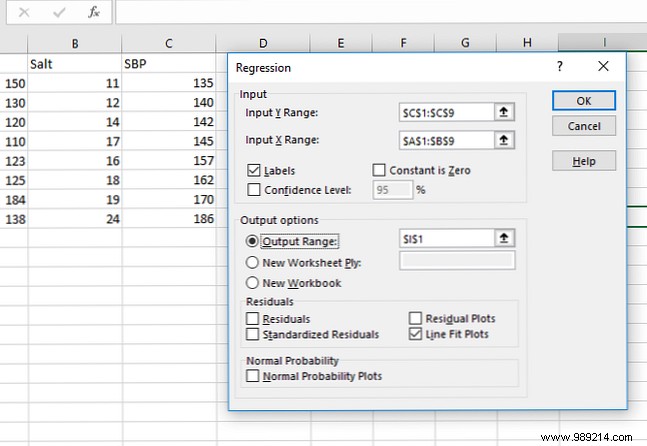
OK yields detailed output. Highlighted p-values:
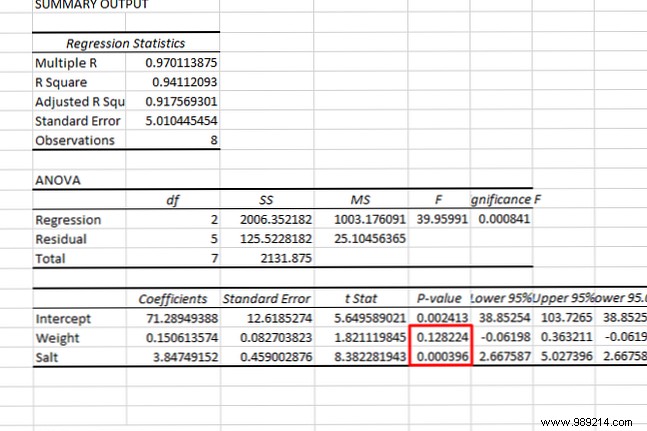
p < 0.05 for salt—significant predictor; weight not. Visualize with trendlines: Cómo visualizar su análisis de datos con Power Tools de Excel.
Read HBR's regression guide for business applications.
Don't underestimate Excel post-ToolPak. Experiment to unlock its potential. Next: Goal Seek, IF statements, dropdowns. Free stats resources: Learn Statistics for Free with These 6 Resources.