Visualizing data with charts and graphs in Excel can transform complex numbers into clear, impactful insights. With years of experience helping professionals analyze data, I've found Excel's charting tools to be incredibly powerful and user-friendly. You can even create auto-updating charts for dynamic reports—check out our guides on powerful charts and tables or auto-updating charts in 3 easy steps.
If you're short on data, start with free sample datasets from dummies.com.
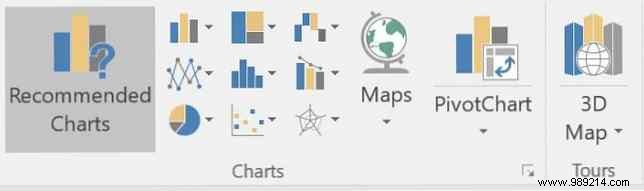
Enter your data, then select it all with Ctrl + A, or highlight specific cells for targeted charts. For the best chart type, see our expert guide: 8 Types of Excel Charts and When to Use Them.
Easily copy charts into Word, PowerPoint, or Photoshop for polished designs.
What charts do you create most in Excel? Share your tips or favorite tools in the comments!