Family Encyclopedia >> Work

How to Create and Customize a Pie Chart in Microsoft Excel: Step-by-Step Guide

A pie chart is an effective visual tool for showing proportions within a whole, breaking down data into clear, digestible slices. If you're already using Microsoft Excel to manage and analyze your data, creating a pie chart is a straightforward next step to enhance your presentations and reports.

We'll walk you through the process using a simple dataset, with tips for customization. As Excel power users know, pie charts shine with one data series, no zero or negative values, and no more than seven categories for readability.

Prepare Your Data

The foundation of any great pie chart is well-formatted data. Import or enter your data into a row or column. Excel automatically updates the chart as you edit values.

How to Create and Customize a Pie Chart in Microsoft Excel: Step-by-Step Guide

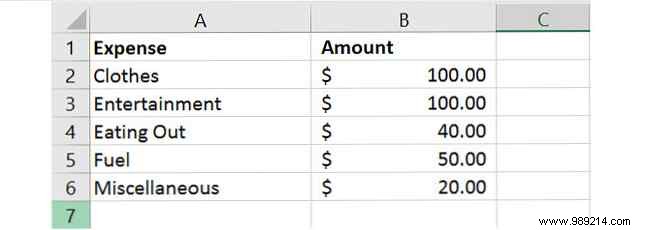
Per Microsoft Office support, pie charts work best when:

  • You have only one data series.
  • None of the data values are zero or less than zero.
  • You do not have more than seven categories, as more than seven portions can make a chart difficult to read.

With every data change, the pie chart refreshes automatically for real-time insights.

Create a Basic Pie Chart

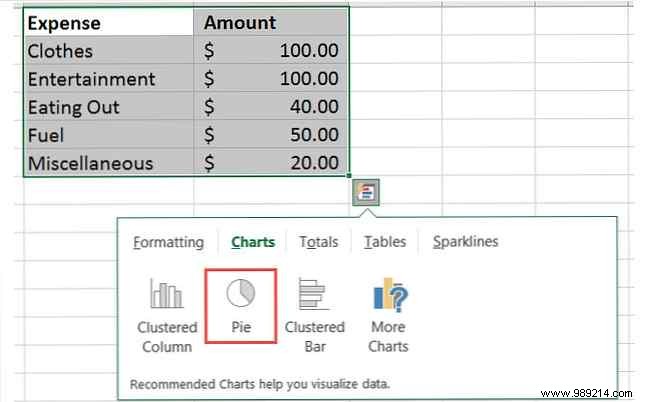
Select your data cells, then use one of these methods to insert the chart:

Method 1: Quick Analysis

Right-click the selected cells, choose Quick Analysis, go to Charts > Pie. Hover to preview, then click to insert.

How to Create and Customize a Pie Chart in Microsoft Excel: Step-by-Step Guide

Method 2: Insert Tab

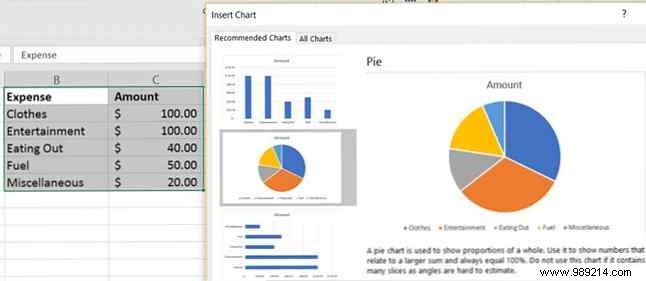
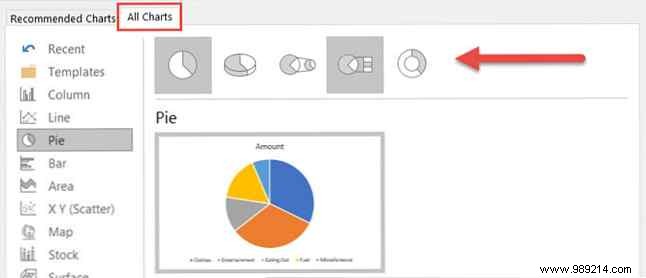
Select cells, click Insert > arrow in Charts group. Check Recommended Charts, or go to All Charts > Pie.

How to Create and Customize a Pie Chart in Microsoft Excel: Step-by-Step Guide

Choose from basic pie, 3-D pie, pie of pie, bar of pie, or doughnut. Click OK to add it to your sheet.

How to Create and Customize a Pie Chart in Microsoft Excel: Step-by-Step Guide

Format Your Pie Chart

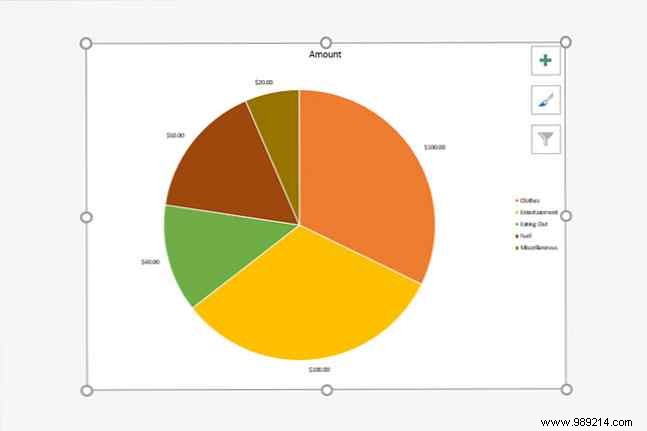
Click the chart to reveal the Chart Tools menu on the right. Customize titles, labels, legends, colors, styles, and filters effortlessly.

How to Create and Customize a Pie Chart in Microsoft Excel: Step-by-Step Guide

Adjust Chart Elements

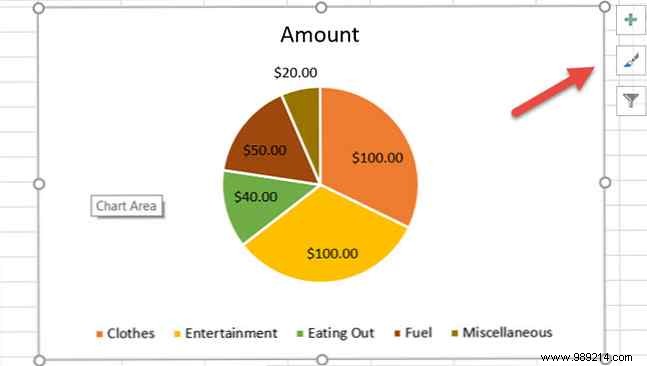
Click Chart Elements (+ icon) for options.

How to Create and Customize a Pie Chart in Microsoft Excel: Step-by-Step Guide

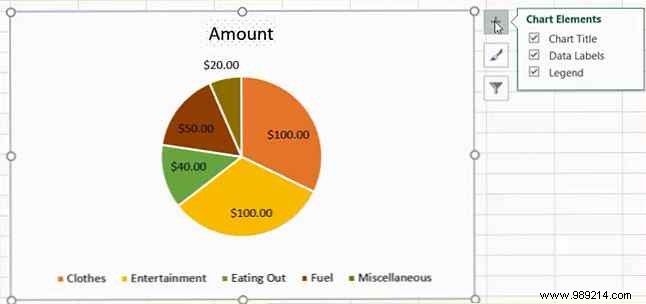
Chart Title: Position above or centered overlay.
How to Create and Customize a Pie Chart in Microsoft Excel: Step-by-Step Guide

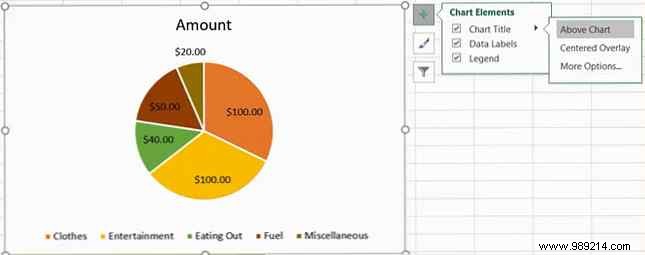
Data Labels: Choose from five positions.
How to Create and Customize a Pie Chart in Microsoft Excel: Step-by-Step Guide

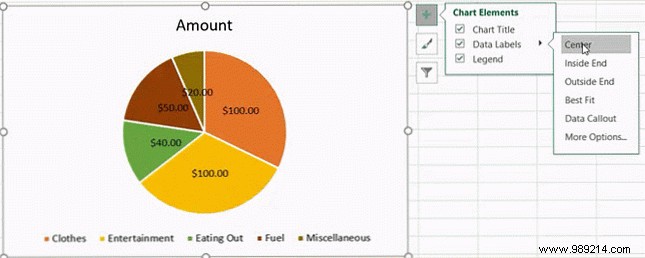
Legend: Place on any side.
How to Create and Customize a Pie Chart in Microsoft Excel: Step-by-Step Guide

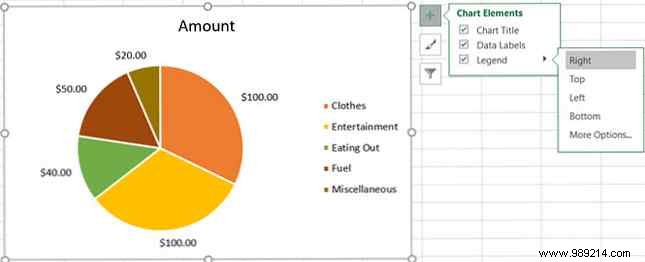
More Options: Fine-tune fills, borders, shadows via the sidebar. Format chart area too.
How to Create and Customize a Pie Chart in Microsoft Excel: Step-by-Step Guide

Change Chart Styles

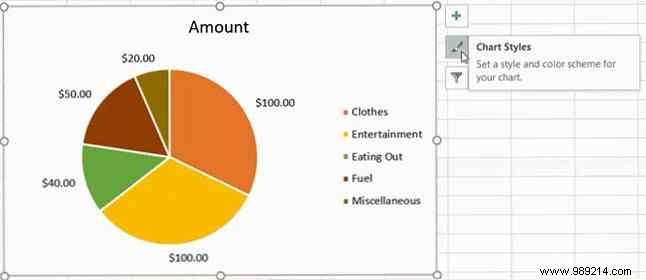
Use Chart Styles for quick makeovers.

How to Create and Customize a Pie Chart in Microsoft Excel: Step-by-Step Guide

Style: 12 options like patterns or two-tone.
How to Create and Customize a Pie Chart in Microsoft Excel: Step-by-Step Guide

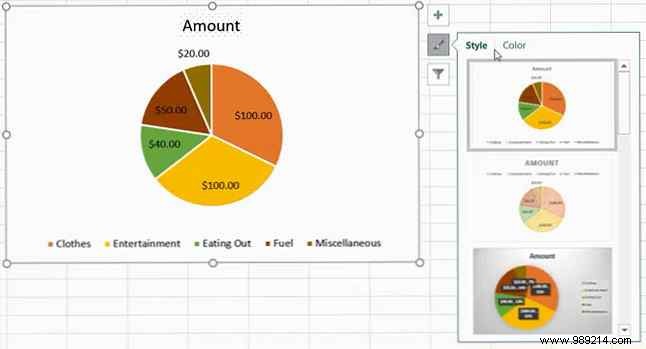
Color: Vibrant or monochrome schemes.
How to Create and Customize a Pie Chart in Microsoft Excel: Step-by-Step Guide

Apply Chart Filters

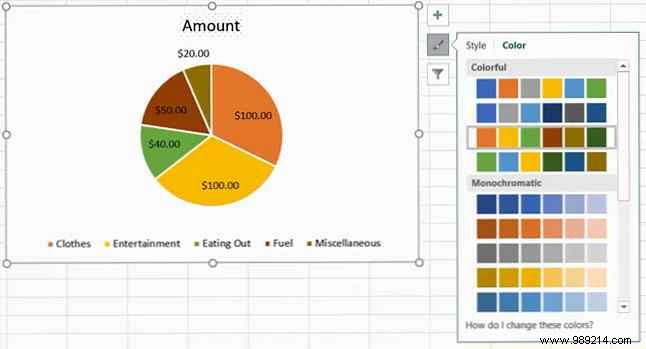
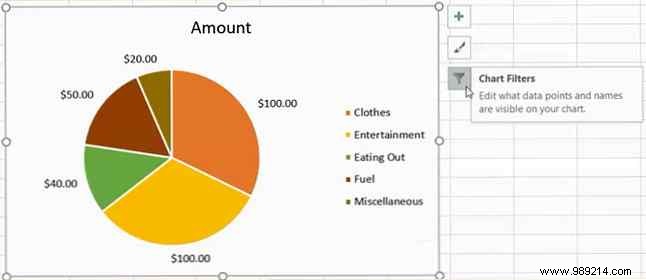
Click Chart Filters (funnel icon) to show/hide slices.

How to Create and Customize a Pie Chart in Microsoft Excel: Step-by-Step Guide

Values: Check/uncheck categories, click Apply.
How to Create and Customize a Pie Chart in Microsoft Excel: Step-by-Step Guide

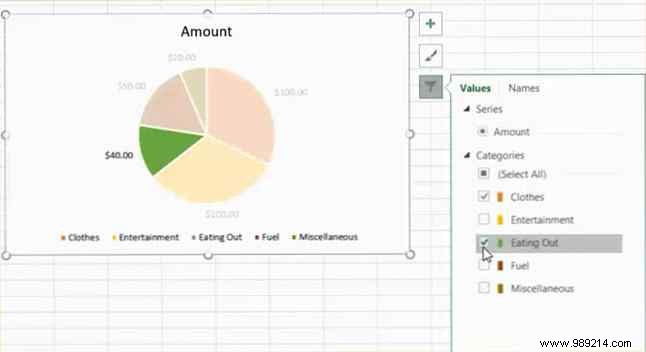
Names: Filter series/categories, click Apply.
How to Create and Customize a Pie Chart in Microsoft Excel: Step-by-Step Guide

Resize, Drag, or Move the Chart

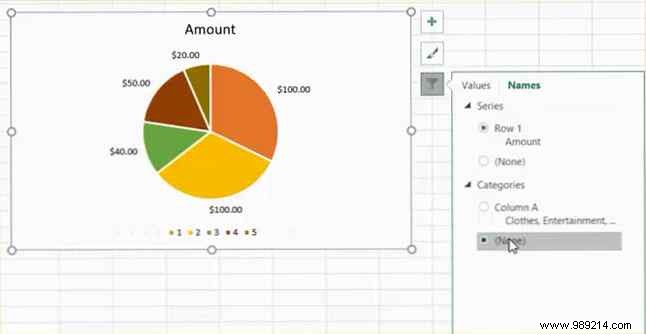
Excel places it optimally, but adjust as needed.

Resize

Drag corner handles (double-arrow cursor).
How to Create and Customize a Pie Chart in Microsoft Excel: Step-by-Step Guide

Drag

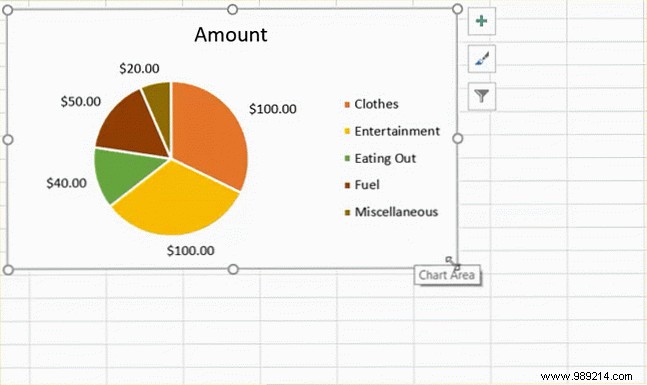
Drag with four-way arrow.
How to Create and Customize a Pie Chart in Microsoft Excel: Step-by-Step Guide

Move

Right-click > Move Chart > Object in or New sheet.
How to Create and Customize a Pie Chart in Microsoft Excel: Step-by-Step GuideHow to Create and Customize a Pie Chart in Microsoft Excel: Step-by-Step Guide

Add to a PowerPoint Presentation

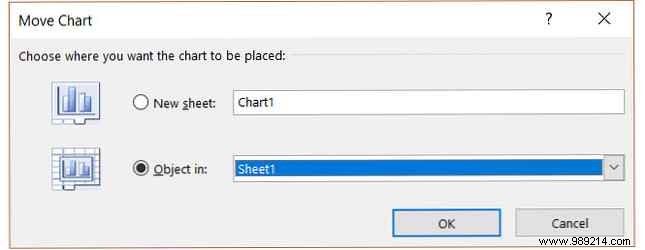
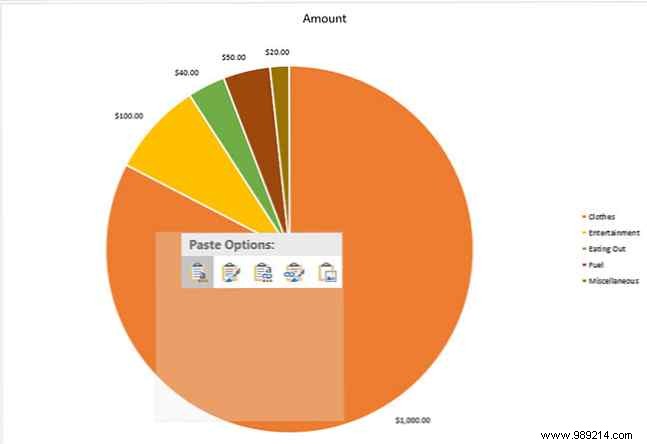
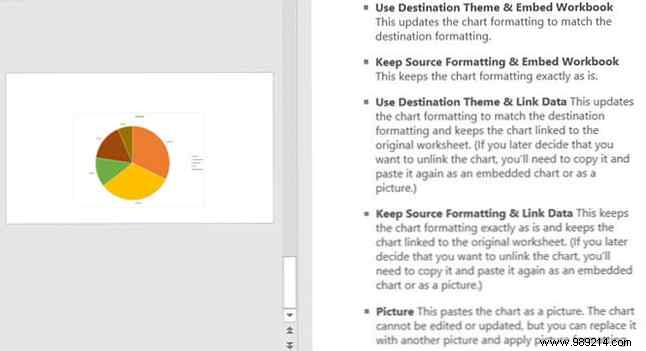
Copy (Home > Copy or right-click) and paste into PowerPoint slide. Choose link/embed or image options.
How to Create and Customize a Pie Chart in Microsoft Excel: Step-by-Step GuideHow to Create and Customize a Pie Chart in Microsoft Excel: Step-by-Step GuideHow to Create and Customize a Pie Chart in Microsoft Excel: Step-by-Step Guide

Ready to Chart?

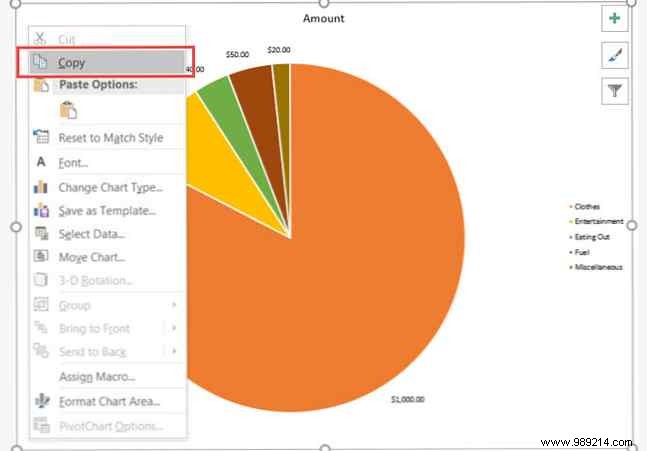
Creating and styling pie charts in Excel is simple and versatile. Experiment with options to match your needs. Have you tried these features? Share your tips below!